f_cumulative
-
stats.f_cumulative(xs, ys, normalized=False)¶ cumulative calculation
- Parameters
xs (np.array) – x values
ys (np.array) – y values. ys.size = xs.size-1 or ys.size = xs.size
normalized (bool) – if normalized=True, the cumulative is normalized to 1
- Returns
cumulative_values – array of size xs.size-1, not normalized
- Return type
np.array
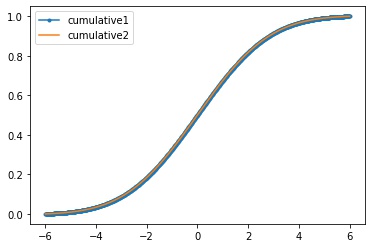
Examples
>>> import numpy as np
>>> import matplotlib.pyplot as plt
>>> import qilum.stats as qs
>>> xs = np.linspace(-6,6, 1001)
>>> ys = 3.*np.exp(-np.square(xs)/10.)
>>>
>>> # calcul
>>> # same size for xs and ys
>>> cumulative1 = qs.f_cumulative(xs, ys, normalized=True)
>>>
>>> # xs are intervals where ys are constant: xs.size = ys.size+1
>>> ys = 0.5*(np.roll(ys,-1)+ys)[:-1]
>>> cumulative2 = qs.f_cumulative(xs, ys, normalized=True)
>>>
>>> # plot
>>> plt.plot(xs[1:], cumulative1, label='cumulative1',marker='.')
>>> plt.plot(xs[1:], cumulative2, label='cumulative2')
>>> plt.legend()
>>> plt.show()