f_walker
-
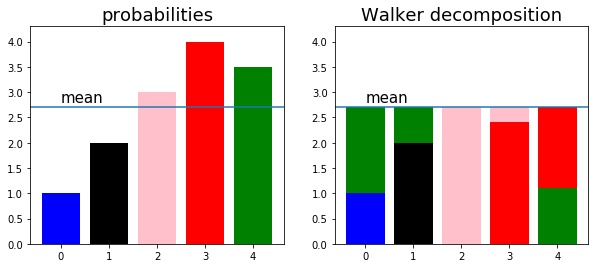
stats.f_walker(probabilities)¶ given N probabilities , return a series of N boxes of value mean(probabilities) with 2 indices in each.
- Parameters
probabilities (np.array) – an array of probability
- Returns
probabilities(P), indices(a)
- Return type
np.array, np.array
Examples
>>> import numpy as np
>>> import matplotlib.pyplot as plt
>>> import qilum.stats as qs
>>>
>>> # calcul
>>> probabilities = np.array([1,2,3,4,3.5], dtype=np.float64)
>>> P0, a = qs.f_walker(probabilities)
>>> print("P0=",P0)
P0= [0.37037037 0.74074074 0.         0.88888889 0.40740741]
>>> print("a=",a)
a= [4 4 2 2 3]
>>>
>>> # figure
>>> mean = probabilities.mean()
>>> colors = np.array(['blue','black','pink','red','green'])
>>> P1 = 1-P0
>>> P0 = P0*mean
>>> P1 = P1*mean
>>> ind = np.arange(P0.size)
>>> print("P0*mean=",P0)
P0*mean= [1.  2.  0.  2.4 1.1]
>>>
>>> # plot
>>> plt.figure(figsize=(10,4))
>>>
>>> plt.subplot(1,2,1)
>>> plt.ylim(0,4.3)
>>> plt.bar(ind, probabilities, color=colors)
>>> plt.axhline(y=mean)
>>> plt.text(0, mean+0.1, 'mean', fontsize=15)
>>> plt.title('probabilities', fontsize=18)
>>>
>>> plt.subplot(1,2,2)
>>> plt.ylim(0,4.3)
>>> plt.bar(ind, P0, color=colors)
>>> plt.bar(ind, P1, bottom=P0, color=colors[a])
>>> plt.axhline(y=mean)
>>> plt.text(0, mean+0.1, 'mean', fontsize=15)
>>> plt.title('Walker decomposition', fontsize=18)
>>>
>>> # calcul
>>> xs_inter, ys_inter = qs.f_max(xs, ys, 10)
>>> plt.show()
References:
- 1
A.J. Walker, ACM Transaction on Mathematical Software 3 (1977) 253
- 2
http://www.damienloison.com/fast_algorithms/Potts/index.html
- 3
http://www.damienloison.com/fast_algorithms/Potts/create_Potts_walker.c